
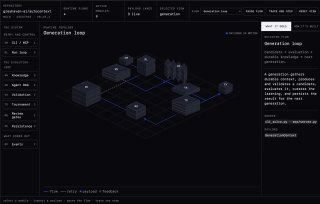
В Х хайпит промпт, который превращает любой репозиторий в интерактивную 3D-карту 🧠 Кидаете его в Claude и получаете изометрическую схему проекта с зависимостями, потоками данных и пояснениями. Analyze [repo] at latest main. Create an isometric system map with legend and explainer panel. Show infrastructure as varied 3D buildings on a grid, with dependencies and payloads tracing real control/data paths. Cite files. Разбираться в чужом коде так будет явно проще 👍